 Spreadsheet Confession
Case Study: Rebuilding an Operations Process from a 12-Tab Workbook
A composite before-and-after migration: the 12-tab mess, the design decisions, three expensive mistakes, and what changed six months later.
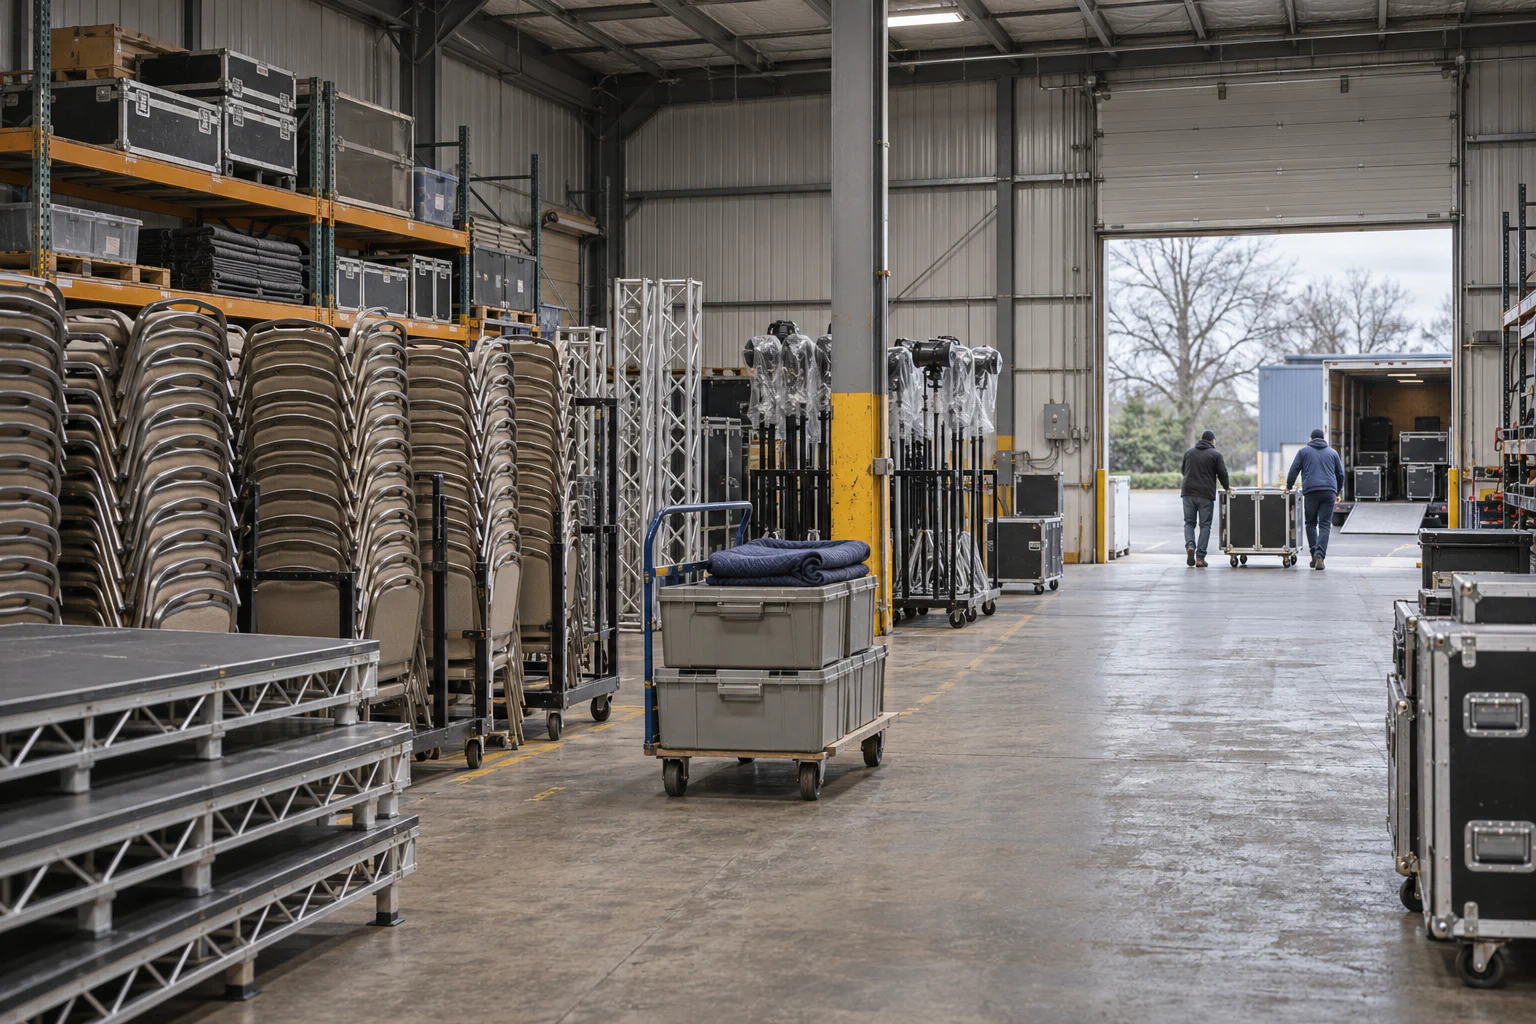
Northfield Rentals hires out staging, furniture and lighting for corporate events. Forty people, around 150 bookings a month, and one workbook called “Bookings MASTER v14 (USE THIS ONE)” with twelve tabs, 9,000 rows and a colour legend at the top of tab one that nobody followed.
Northfield is a composite of several real migrations, with names and numbers changed and details blended. Every mistake in it happened to somebody.
The before
The tabs told the story of the business’s growth. “Bookings” was the original. “Bookings 2” appeared when the first one got slow. “Stock” listed every item, “Out” tracked what was on site, and “Damages” was added after a bad season. There was a “Drivers” tab, a “Quotes” tab, a “Deposits” tab maintained by finance, and a tab called “DO NOT DELETE” holding a single lookup table that everything else depended on.
Status lived in cell colours. Yellow meant quoted, green meant confirmed, orange meant “check with Dana”. Dana was the operations manager who had built most of it, and the only person who could explain why column AF existed.
The pain was predictable:
- Popular items were double-booked about twice a month, each time followed by an awkward call to a client.
- Every Friday, two coordinators spent most of the afternoon reconciling “Out” against “Stock”.
- Finance kept a private copy of “Deposits” because people kept sorting the shared one.
- When Dana took two weeks of leave, the team ran on memory and guesswork.
Using the method in The Hidden Cost of “It’s Just a Spreadsheet”, they estimated roughly 25 hours a week of reconciliation and rework, plus the double bookings, which had already cost them one repeat client.
Getting permission
The ops lead pitched it the way Getting Buy-In: Pitching an Internal Tool to Leadership recommends. She led with risk (Dana as a single point of failure, and the lost client), showed the hours, halved them, and asked for a ten-week pilot covering bookings and stock only. Leadership said yes largely because the ask was small.
Mapping before building
The first two weeks involved no new tool at all. The team followed Process First, Tool Second: Documenting a Workflow Before You Build It, sitting with each coordinator and writing down what actually happened from enquiry to return.
This surfaced the most important discovery of the project: the twelve tabs held only five real things. Using the approach in From Rows to Records: How to Think About Your Data Like an Application, they identified Clients, Bookings, Items, Booking Lines (which item, how many, which dates) and Damage Reports. “Bookings 2” was just more bookings. “Out” was a filtered view of booking lines covering today. “DO NOT DELETE” was a list of item categories.
That insight, that a booking has many lines and each line points at an item, is what made double-booking checks possible. In the workbook, items were typed into one free-text cell as “4x round table, 2x lectern”, which no formula could check against stock.
Design decisions
Configure, not build. Working through Buy, Configure, or Build? A Decision Framework for Internal Tooling, they ruled out off-the-shelf rental software (too rigid for their quoting) and a custom app (no developers). They chose a no-code database platform with forms and basic automations.
Real states instead of colours. Following Replacing the “Status” Column: Designing Real Workflows with States and Transitions, bookings got five defined states: Enquiry, Quoted, Confirmed, On Hire, Closed. Only coordinators could move a booking to Confirmed, and only once a deposit was recorded. “Check with Dana” was deliberately not a state.
Availability as a rule, not a check. When someone added a booking line, the system compared the requested quantity with stock minus everything already confirmed for overlapping dates. If it didn’t fit, the line was flagged before the quote went out.
Finance gets a view, not a copy. Deposits became a field on the booking, with finance given edit rights to that field only, as in Permissions That Make Sense: Who Should See and Edit What.
Three mistakes
Migrating dirty data. The first import brought over 1,400 client records, about 300 of them duplicates (“ACME Ltd”, “Acme Limited”, “acme - Jo”). They had skipped most of Cleaning Your Spreadsheet Data Before Migration: A Practical Guide because the deadline felt tight. Undoing it cost a week, more than the cleaning would have taken.
Too many notifications. Early enthusiasm produced a chat message for every state change. Within ten days people had muted the channel, including the alerts that mattered. They cut it to three: availability conflicts, overdue deposits and unreturned items. Automations That Actually Save Time (And the Ones That Just Create Noise) describes this exact trap.
Parallel running with no end date. They ran the workbook alongside the new tool but never set a source-of-truth date, the one thing How to Run the Old Sheet and New Tool in Parallel (Without Losing Your Mind) insists on. After three weeks, half the team trusted one system and half the other. They announced a hard cutover, worked through the Migration Day Checklist: Retiring a Business-Critical Spreadsheet, and archived the workbook as read-only.
Getting people to use it
Two coordinators were openly sceptical. Rather than mandate the switch, the ops lead asked what they still opened the sheet for. The answer was a quick “what’s out this weekend” glance on a phone, which the new tool hadn’t covered. A simple mobile view fixed it. Training was five short walkthroughs and twice-weekly office hours, along the lines of Training Users Without a 40-Page Manual, with one former sceptic as team champion.
The after
Six months on, the illustrative numbers looked roughly like this:
| Measure | Before | After |
|---|---|---|
| Double bookings per month | About 2 | None in the last four months |
| Friday reconciliation | ~6 hours across two people | Gone; “Out” is a live view |
| “Is X free on the 14th?” | 10–15 minutes | Under a minute |
| People who can run the process unaided | 1 | 6 |
| Weekly rework hours (team estimate) | ~25 | ~6 |
The biggest change wasn’t in the table. When Dana took leave the following summer, nothing happened. That was the point.
They also set up weekly exports and a written exit plan, and resisted adding a separate quoting tool, keeping quotes in the same system to avoid the trap described in Avoiding Tool Sprawl: How Not to Trade Spreadsheet Purgatory for SaaS Purgatory.
Where to start this week
- List the tabs in your biggest workbook. Beside each, write which real entity it holds, or “view” if it’s just a filtered copy of another tab.
- Find a free-text cell that hides a list (like “4x round table”) and sketch it as separate records.
- Write down the one incident from the last year that would make your leadership team wince. That’s your pitch.
- If you’re already running old and new in parallel, pick a cutover date and tell people today.